Android runtime internals and performance engineering
Trace startup, the main thread, Binder, rendering, memory, ANRs, and compilation so performance work begins with evidence.
Senior performance work begins with a causal model, a user-visible metric, and evidence that connects them. A slow screen may be waiting for process startup, code loading, main-thread work, a Binder reply, image decoding, allocation or garbage collection, or a missed frame deadline. A micro-optimization that cannot name its measured cause is a guess.
This chapter follows the runtime from process creation to a presented frame. It then uses that model to diagnose ANRs, jank, memory pressure, startup latency, and compilation behavior. The objective is not to memorize internals; it is to choose the next diagnostic tool from a plausible failure mechanism.
Learning goals
- Trace a cold launch from process creation to useful content.
- Explain the main thread,
Looper,MessageQueue, Choreographer, and Binder boundaries. - Distinguish cold, warm, and hot startup.
- Diagnose jank, ANRs, memory pressure, and leaks with appropriate tools.
- Explain ART compilation, R8, Baseline Profiles, and Startup Profiles.
A process starts before your first screen
Android app processes are usually forked from Zygote, a long-lived process that preloads common framework classes and resources. Forking lets apps share clean memory pages until a process modifies them.
A simplified cold-start path is:
- Launcher or another caller asks the system to start an app component.
system_serverresolves the component and determines that no suitable app process exists.- Zygote forks a process with the app’s UID and runtime configuration.
- The process initializes its main thread and binds the application.
- Content providers and the
Applicationobject are created according to platform startup order. - The target Activity is created.
- The first frame is measured, laid out, drawn, and presented.
- User-meaningful content arrives.
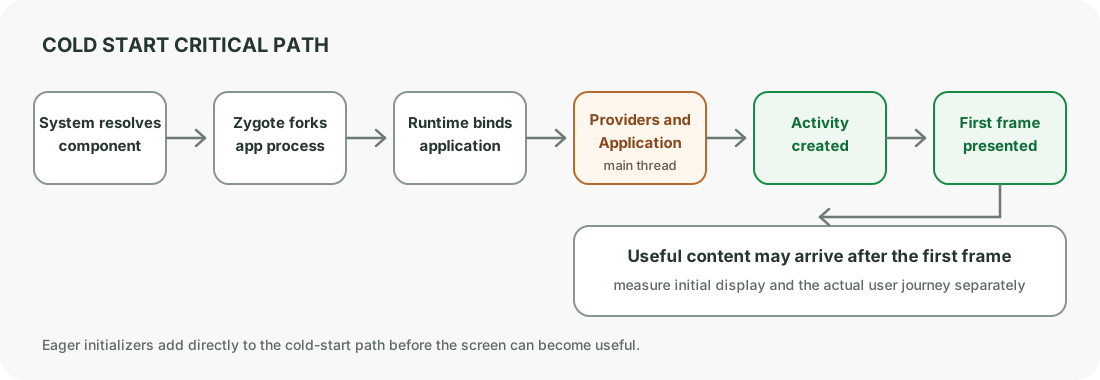
This is why automatic ContentProvider initializers and eager SDK initialization can slow startup before Activity.onCreate().
Cold, warm, and hot startup
- Cold: no app process exists. Android creates the process and Activity.
- Warm: the process exists, but the Activity must be created or recreated.
- Hot: process and Activity remain, so the task is brought to foreground with less reconstruction.
Optimize cold startup first because it contains the most work and establishes whether initialization is correctly deferred. Measure all entry points that matter, including launcher, deep link, and notification.
Time to initial display vs fully drawn
Initial display measures the first frame. It may be a skeleton or placeholder. A fully drawn signal should correspond to content that is useful for the chosen journey. Do not improve a metric by reporting completion before meaningful content is ready.
The main thread event loop
The process main thread owns a Looper with a MessageQueue. Framework callbacks, input dispatch, lifecycle calls, posted Runnables, and much UI work are serialized through this thread.
Handler(Looper.getMainLooper()).post {
    render(state)
}
The API schedules work. It does not create a new thread.
Choreographer and frames
Choreographer coordinates frame callbacks with display timing. UI state changes can schedule traversal, after which the hierarchy performs required measure, layout, and draw work before the frame deadline.
Jank can come from:
- Long-running work on the main thread.
- Excessive layout or composition work.
- Synchronous Binder or disk waits.
- Bitmap decode and upload.
- Garbage collection caused by heavy allocation.
- GPU overdraw or expensive effects.
- Lock contention where the main thread waits for another thread.
Do not assume every long frame is CPU work. A trace distinguishes running, runnable, sleeping, blocked, and Binder-wait states.
Binder is the platform IPC backbone
Binder carries calls between processes such as your app, system_server, media services, and content providers. A proxy marshals arguments into a Parcel, the kernel driver routes the transaction, and a Binder thread in the target process handles it.
Important boundaries:
- A synchronous Binder call blocks the caller until the response returns.
- A remote service can be slow or dead.
- Arguments must be parcelable and transactions are size-limited.
- Calls can arrive concurrently on a Binder thread pool.
- Caller identity can matter for permission checks.
Large Intent extras or saved-state bundles can contribute to TransactionTooLargeException. The transaction buffer is shared across in-flight transactions in a process, so there is no safe strategy based on approaching a single headline limit. Pass IDs and reload large data.
DeadObjectException
If a remote Binder process dies, a call can fail with DeadObjectException, a subclass of RemoteException. Recovery depends on the API: reconnect, retry only if safe, or show degraded state. Catching every RemoteException and continuing as if the operation succeeded corrupts product truth.
Threads and coroutine dispatchers
Coroutines schedule work onto threads; they do not remove thread-safety concerns.
Dispatchers.Maintargets the UI thread.Dispatchers.Defaultuses a shared pool sized for CPU work.Dispatchers.IOuses a shared pool designed for blocking I/O.limitedParallelism()can bound concurrency for a particular workload.
Too much parallelism can increase contention, memory use, server load, and tail latency. For CPU-bound work, more coroutines than cores do not create more CPU.
ANRs are responsiveness failures
An Application Not Responding condition is triggered when the app fails to respond within a platform-defined deadline for a monitored operation. Input dispatch, component execution, and broadcast handling have different rules. Exact timeout behavior can vary by Android version and device implementation.
Common causes:
- Main thread waits for disk, network, Binder, or a lock.
- Expensive startup or component lifecycle work.
- A broadcast receiver performs too much synchronous work.
- Another thread holds a lock needed by the main thread.
- The system is heavily loaded and the app thread is not scheduled.
Read the trace, not only the top frame
An ANR stack snapshot can be late. A main thread parked in nativePollOnce may simply mean it became idle before collection. Use Play Console clusters, timestamps, other thread stacks, and Perfetto when available.
Classify the main thread:
| Thread state | Question |
|---|---|
| Running | Which method consumes CPU? |
| Runnable | Is CPU starvation or system load preventing scheduling? |
| Blocked | Which thread owns the monitor? |
| Waiting | Binder, condition variable, future, or latch? |
| Sleeping | Why is the main thread intentionally delayed? |
Never call Thread.sleep(), wait on a Future, or join a worker from the main thread in production UI flow.
Memory pressure and garbage collection
ART uses garbage collection, but memory is still finite. Problems include:
- Leak: unreachable product state remains strongly reachable.
- Churn: many short-lived allocations trigger frequent collection.
- Peak: a legitimate operation temporarily needs too much memory.
- Fragmentation or native pressure: free memory exists but not in the needed form, or native allocations dominate.
Bitmap memory, native buffers, WebView, media codecs, and graphics resources may not appear like ordinary Kotlin object graphs.
Leak investigation
- Reproduce a lifecycle transition repeatedly.
- Force or wait for collection in a diagnostic environment.
- Find retained instances in a heap dump or LeakCanary report.
- Follow the shortest strong-reference path to a GC root.
- Fix the ownership mismatch.
- Repeat the scenario and confirm the retained count stabilizes.
Do not “fix” a leak by replacing every Activity context with application context. The correct fix is to stop a long-lived owner from retaining UI state it does not own.
Image memory and caches
Decoded bitmap memory roughly scales with width, height, and bytes per pixel. A large source image displayed in a small avatar wastes decode, memory, upload, and cache capacity.
Use an image library to:
- Request an appropriate target size.
- Reuse memory and disk cache.
- Cancel requests with lifecycle.
- Decode off the main thread.
- Avoid storing unbounded bitmaps in app-owned collections.
A cache should have a size bound and eviction policy. LruCache is not durable storage and can disappear with the process.
ART, DEX, and compilation
D8 converts JVM bytecode to DEX and performs desugaring. R8 can shrink, optimize, and obfuscate release code. ART executes DEX using a mixture of interpretation, just-in-time compilation, and ahead-of-time compilation depending on Android version and profile state.
This explains why debug, freshly installed release, and warmed production behavior can differ.
Baseline Profiles and Startup Profiles
A Baseline Profile records important code paths so ART can precompile them without waiting for organic usage data. Include startup and representative critical journeys, such as scrolling a main feed or completing checkout.
A Startup Profile is used by the build toolchain to improve DEX layout for startup-critical code. It complements, rather than replaces, a Baseline Profile.
Treat profile generation as release code:
- Generate against a representative release-like build.
- Use stable journeys with assertions.
- Include common paths, not every feature.
- Measure Macrobenchmark results before and after.
- Keep profiles updated when navigation and startup change.
Measurement toolbox
| Problem | Strong first tool |
|---|---|
| Cold startup | Macrobenchmark and Perfetto trace |
| Scroll jank | JankStats or frame metrics, then Perfetto |
| Main-thread I/O | StrictMode in debug, then trace |
| CPU hotspot | CPU profiler or sampled trace |
| Memory growth | Heap dump, allocation recording, LeakCanary |
| Database query | Room query callback, SQLite plan, trace section |
| Release field regression | Android vitals, telemetry percentiles, staged rollout |
Use release-like builds on representative physical devices. Debuggable builds and emulator host conditions can distort compiler and timing behavior.
Performance experiments
Write a falsifiable hypothesis:
Observation: p95 cold start to useful feed is 1.9 s on low-RAM devices.
Trace: 420 ms is spent initializing three SDKs before first Activity draw.
Change: lazy-initialize two SDKs after first useful frame.
Expected: reduce p95 by at least 250 ms without losing required events.
Guardrails: crash-free sessions, event completeness, and first interaction latency.
Compare percentiles, not only averages. A good median can hide a painful p95 or p99.
Common pitfalls
- Profiling a debug build and generalizing to release.
- Treating every slow frame as recomposition.
- Posting blocking work to a
Handlerand calling it background work. - Ignoring synchronous Binder calls on the main thread.
- Reading only the top frame of an ANR snapshot.
- Adding an unbounded cache to fix repeated work.
- Generating a Baseline Profile without measuring representative journeys.
- Reporting initial display before the screen is useful.
Examination prompts
- “Walk through a cold app start.”
- “How do Handler, Looper, and MessageQueue relate?”
- “What happens in a Binder call?”
- “Why does
TransactionTooLargeExceptionhappen?” - “How would you diagnose an ANR?”
- “Leak vs allocation churn?”
- “D8 vs R8 vs ART?”
- “Baseline Profile vs Startup Profile?”
- “How would you prove your optimization worked?”
Practice checklist
- Capture a cold-start Macrobenchmark and label the critical path.
- Add trace sections around one suspected startup initializer.
- Reproduce and fix one retained Activity or Fragment view.
- Record a scroll trace and classify the longest frame by thread state.
- Generate a Baseline Profile for startup plus one critical journey.
- Write a before-and-after performance result with percentiles and guardrails.
What you should be able to explain
- Process creation, startup stages, and first useful content.
- Main-thread scheduling, rendering deadlines, and Binder waits.
- ANR and memory diagnosis from evidence.
- ART profiles and release-like benchmarking.
Next: security, privacy, and client trust boundaries, where platform mechanics become attack surfaces.
Discussion
Comments are powered by GitHub Discussions. Sign in with GitHub to join in.